Saturated Buffers: Designing for More Than Percentage Efficiency
Grabbing the conservation spotlight in recent years are saturated buffers. While this drainage practice has been around for over a decade, it has been gaining traction as an effective and efficient option for reducing nitrate loss from tile systems. Polk County, Iowa, attests to this in their Batch and Build projects video published earlier this year.
How Saturated Buffers Work
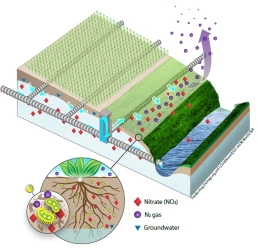
By dispersing a portion of the tile flow through a riparian buffer, soil microbes convert nitrate into atmospheric nitrogen gas (Figure 1).
How Should We Design + Evaluate Saturated Buffers?
We know that saturated buffers work well to remove nitrate. On average, they remove 46% of the annual tile nitrate load. Removal efficiency is primarily limited by the amount of bypass, or non-treated, flow that occurs when the tile flow exceeds the capacity of the saturated buffer. Bypass flow keeps the field drainage unimpeded. Of the drainage flow diverted into the saturated buffer, 80% or more of the nitrate is generally removed (Johnson et al, 2023).
However, that 46% average removal does not tell the whole story. Is 46% a lot? How many pounds is that? Does performance vary from site to site? And if we can answer those questions, what defines a good saturated buffer and how do you design it?
Based on my research, I will answer these questions focusing on three key points:
- Current U.S. Department of Agriculture (USDA)-National Resources Conservation Service (NRCS) design criteria
- Differences in observed performance versus design predictions
- Saturated buffer efficiency compared with total nitrate load, or mass, removal
Current Design Criteria
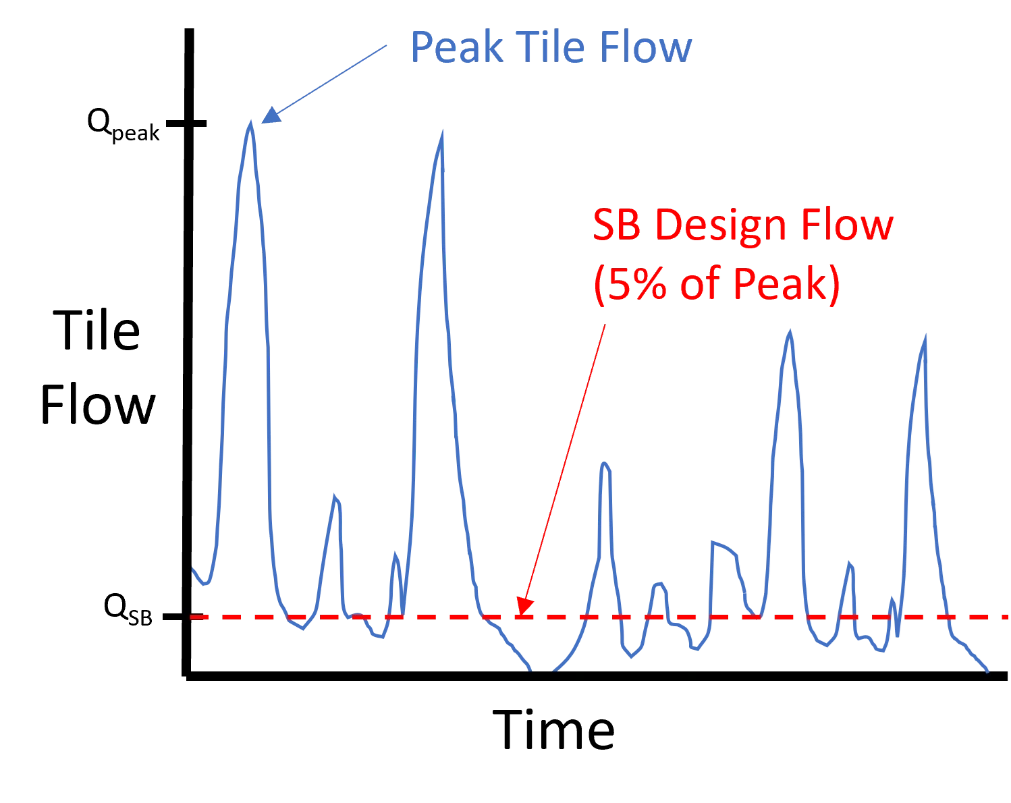
The current USDA-NRCS Conservation Practice Standard Code 604 for saturated buffers specifies that a saturated buffer be designed to treat at least “5 percent of the drainage system capacity or as much as practical based on the available length of the vegetated buffer” (Figure 2).
Drainage system capacity refers to the maximum or peak flowrate expected from the main tile based on the drainage system characteristics. The idea behind this criterion is that treating a certain percentage of the peak drainage system flow should result in capture and treatment of a sufficient percentage of the total annual drainage flow.
However, differences between observed and designed flows, along with a disconnection from nitrate mass load removal, challenge this method’s efficacy.
Saturated Buffers Treat More Flow than Designed
In studies conducted by my colleagues and I, we found the flowrate through saturated buffers exceeded design expectations by a factor of 4 to 19. This was broadly observed across five sites with three to 11 years per site. Although this identified potential differences in the buffer soil properties than expected, it showed saturated buffers work better than the current design method predicts. Using these observed flows, the in-field percentage of peak flow treated exceeded design predictions by a factor of 2 to 12.
Nitrate Load Removal Can Differ from Efficiency
Furthermore, the studies also showed the total mass load removal, or pounds of nitrate removed, within different saturated buffers did not always align with the percentage nitrate removal efficiency. Saturated buffers with larger designed and observed percentage removal generally had lower total mass removal. The site with the greatest average mass removal at 320 pounds per year was the least efficient at 21% of the total load (Figure 3; data adapted from Johnson, 2025).
This disparity arises from differences in drainage system characteristics, mainly the drainage area size of each saturated buffer. Compared with a small drainage system, a larger drainage system had greater flow and delivered greater load to the saturated buffer, increasing the potential load that can be removed. As there is a physical limit to the saturated buffer design capacity, a site located on smaller drainage system would more easily meet the current 5% drainage system capacity efficiency criterion.
In other words, the USDA-NRCS Conservation Practice Standard Code 604 current design standard promotes efficient designs that may remove less nitrate overall.

Strategic Site Selection + Buffer Sizing To Maximize Nitrate Mass Removal
So, what is a good saturated buffer and how do we design one? I would argue that a high-mass nitrate removal saturated buffer is better than a highly efficient saturated buffer with lower mass removal. In an ideal world, maximizing saturated buffer efficiency would maximize total mass removal. However, other factors must be considered, including physical site limits and watershed-scale goals.
There are physical limits to the saturated buffer size and flow capacity. Unlike a denitrifying bioreactor that can be easily scaled to different sizes of drainage systems, saturated buffer size is often limited by the available buffer length and topography. Also under consideration are site- and watershed-scale performance. Saturated buffers located on larger drainage systems remove a greater mass of nitrate and have a greater impact on total watershed nutrient loading.
For saturated buffer designs, designers should target sites within a watershed-scale context to maximize site-level saturated buffer efficiency. To meet watershed-scale nutrient reduction goals, designers should prioritize site selection and design approaches that maximize mass removal, not just hit percentage-efficiency benchmarks. That is how we will continue to advance progress toward state and regional nutrient reduction and water quality goals.
References
Iowa Soybean Association. (2025). Managing Saturated Buffers [Video]. YouTube. https://www.youtube.com/watch?v=KUXOlaaofc4
Johnson, G.M. 2025. Design and Performance Analysis of Saturated Buffers for Nitrate Removal from Agricultural Drainage. [Doctoral dissertation, Iowa State University]. Proquest. https://dr.lib.iastate.edu/handle/20.500.12876/jrl86jMr
Johnson, G.M., Christianson, L.E., Christianson, R.D., Davis, M., Diaz Garcia, C., Groh, T., Isenhart, T.M., Kjaersgaard, J., Malone, R., Pease, L., Rogovska, N. 2023. Effectiveness of Saturated Buffers on Water Pollutant Reduction from Agricultural Drainage. Journal of Natural Resources and Agricultural Ecosystems, 1(1), 49-62. https://doi.org/10.13031/jnrae.15516
Polk County Iowa. (2025). Batch and Build: Redefining Conservation, Accelerating Water Quality Improvements [Video]. YouTube. https://www.youtube.com/watch?v=MLZmrHd-I-4
About the Author
Gabe Johnson, Ph.D., EIT, is a Postdoctoral Research Associate in the Department of Natural Resource Ecology and Management at Iowa State University. He recently completed his Ph.D. in Agricultural and Biosystems Engineering and Sustainable Agriculture at Iowa State University, during which he studied the saturated buffer design and performance.

Related Articles


Five Takeaways from River Connections: A Science + Strategy Workshop for the Mississippi River Watershed
Science and Strategy Workshop for the Mississippi River Watershed, hosted by Tulane University in partnership with America’s Watershed Initiative and The Nature Conservancy, brought together practitioners from across the 31-state Mississippi River Basin to explore how research, policy and implementation are aligning to address shared challenges.